Methods
Overview
This portal provides access to harmonized brain multi-omic xQTL results that can be explored by gene, variant, or genomic region. It integrates data from cohorts such as ROSMAP, MSBB, Knight-ADRC, and MiGA to support discovery, interpretation, and downstream analysis in one searchable resource.
This page explains what data are included, how results are organized, and how to use the portal effectively. For users who want implementation-level detail, please see the medRxiv manuscript and the pipeline Github.io pages.
Analysis pipeline
FunGen-AD xQTL data flow
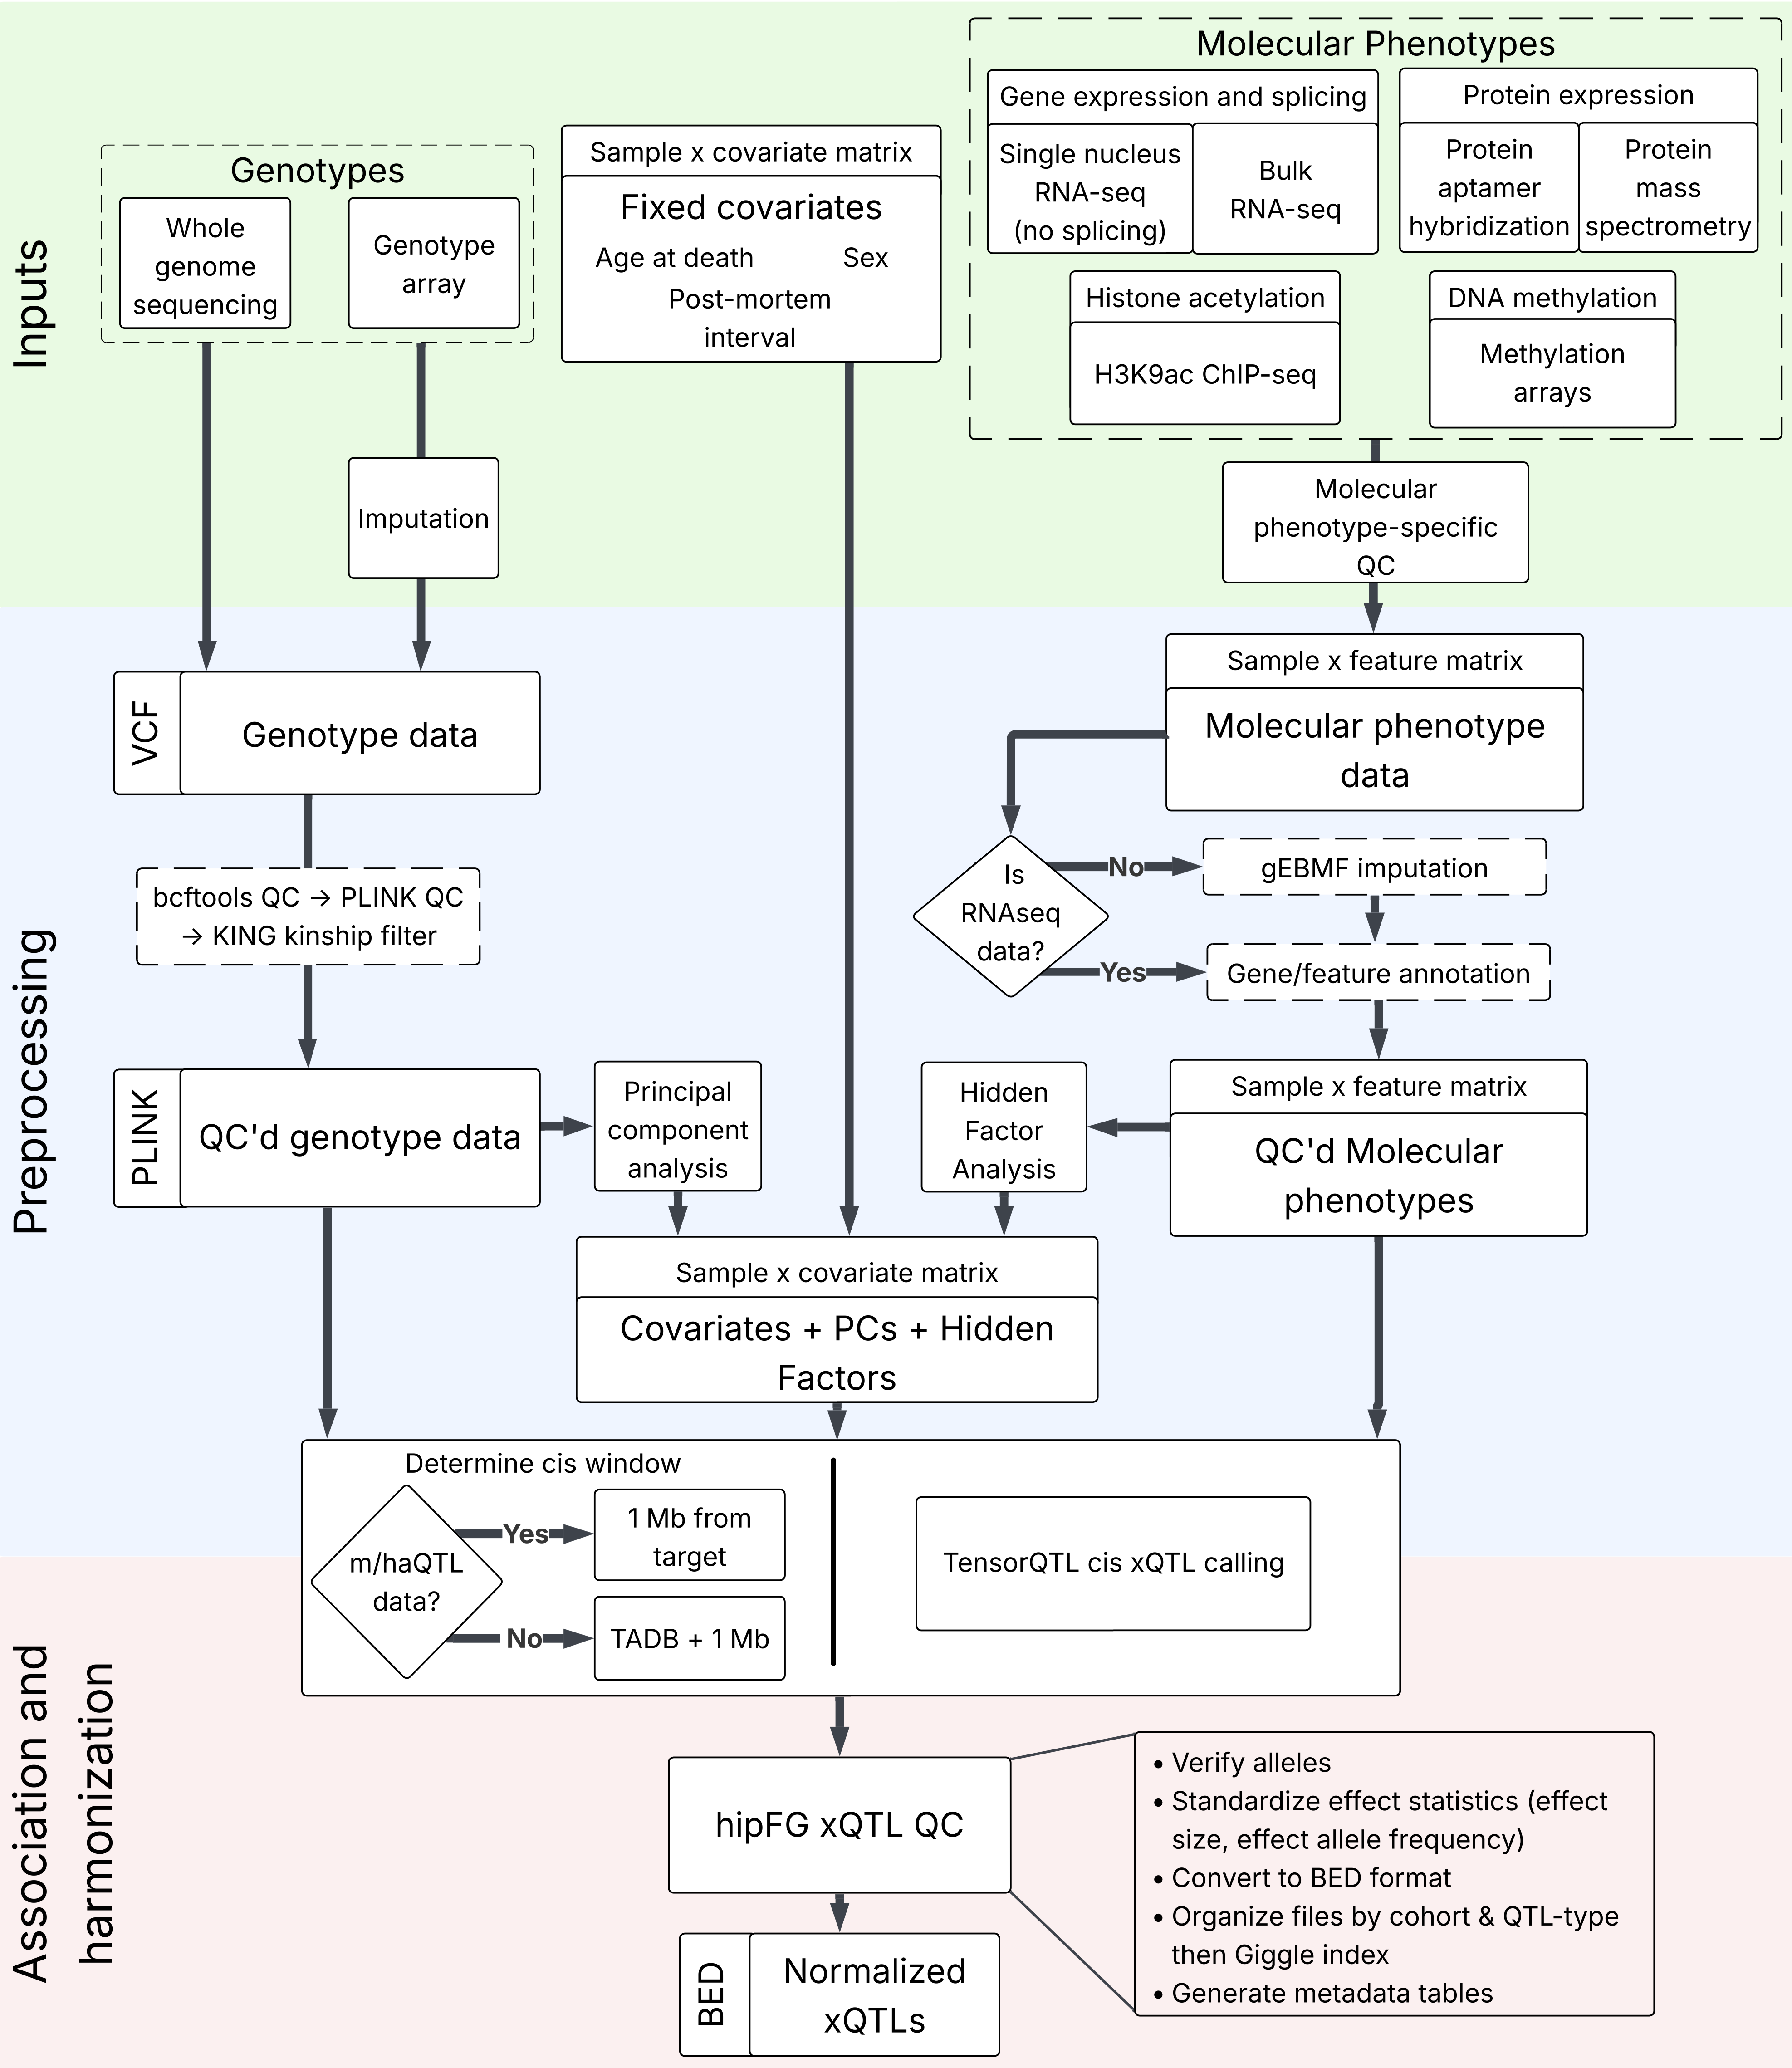
Following sequencing and molecular trait quantification, the xQTL Data Portal followed five main stages. For complete descriptions, please see the manuscript Methods.
-
Preprocessing
Covariate, genotype, and molecular phenotype data were prepared for xQTL calling. Genotype data and each molecular trait were filtered to meet specific QC standards and missing values from molecular traits and genotyping array results underwent respective imputation. Principal components were obtained from genotypes and hidden factors were obtained from molecular traits. These were combined with the covariates to create a final covariate matrix.
TADB-expanded cis testing regions were obtained by combining topologically associated domains (TADs) from brain data with gene spans and expanding their overlap through a recursive algorithm. -
Association testing
Preprocessed genotypes, molecular traits, and covariates were combined to call xQTLs using TensorQTL. SuSiE was used to carry out single context univariate fine-mapping on expression/protein/splicing data, and fSuSiE was used on histone acetylation/DNA methylation data. e/p/sQTLs were tested using TADB-expanded cis windows to go beyond conventional 1 Mb testing distance.
-
Annotation
Molecular targets were mapped to genes in the Gencode v103 gene set; ha/m/sQTLs were associated with overlapped genes based on prioritization of Gencode gene features. All tested variants were similarly annotated with their overlapped genes. Associations were indicated as 'cis' if <1 Mb away, and 'tad' if > 1 Mb away, due to the expanded testing windows. rsIDs from dbSNP build 156 were provided where applicable.
-
Harmonization
Using the harmonization tool hipFG, a common BED format was enforced for all xQTLs and another was enforced for all fine-mapping results. The 'ref' and 'alt' fields were harmonized against dbSNP to ensure that the non-reference allele is always the effect allele, unless indicated with a 'BOTH_ALLELES_MATCH_REFERENCE_GENOME' flag, and effect statistics were updated to reflect this. Invalid '*' alleles were removed. Alleles were left-aligned (e.g., AGAT>AGA reduces to AT>A). Gencode v103 was used as the standard for all target genes.
-
Integration
Results are searchable, browsable, and downloadable through the portal. The back-end is organized by cohort, QTL-type, and association/significance and powered by Giggle to allow for rapid search of the Atlas in its entirety or by subset. This structure is replicated in xQTL dataset downloads via the NIAGADS DSS Open Access Data Portal.
View Detailed workflow here (FunGen-AD xQTL data flow), together with affiliated GitHub code repositories xQTL protocol, hipFG.
Data model and terminology
The portal uses a consistent set of terms to help users interpret results across datasets and views.
- QTL type
- the molecular phenotype being analyzed, such as expression, methylation, protein, histone acetylation, or splicing.
- Cell type
- the cellular population in which the molecular trait was measured or inferred.
- Brain region
- the anatomical source of the sample.
- Significant association
- an xQTL association that passes the statistical threshold defined in the analysis framework (BH FDR<0.05 or HMT-significant).
- Locus
- a genomic region containing one or more variants or associations.